> For the complete documentation index, see [llms.txt](https://docs.datalogz.io/guides/llms.txt). Markdown versions of documentation pages are available by appending `.md` to page URLs; this page is available as [Markdown](https://docs.datalogz.io/guides/inventory.md).
# Inventory
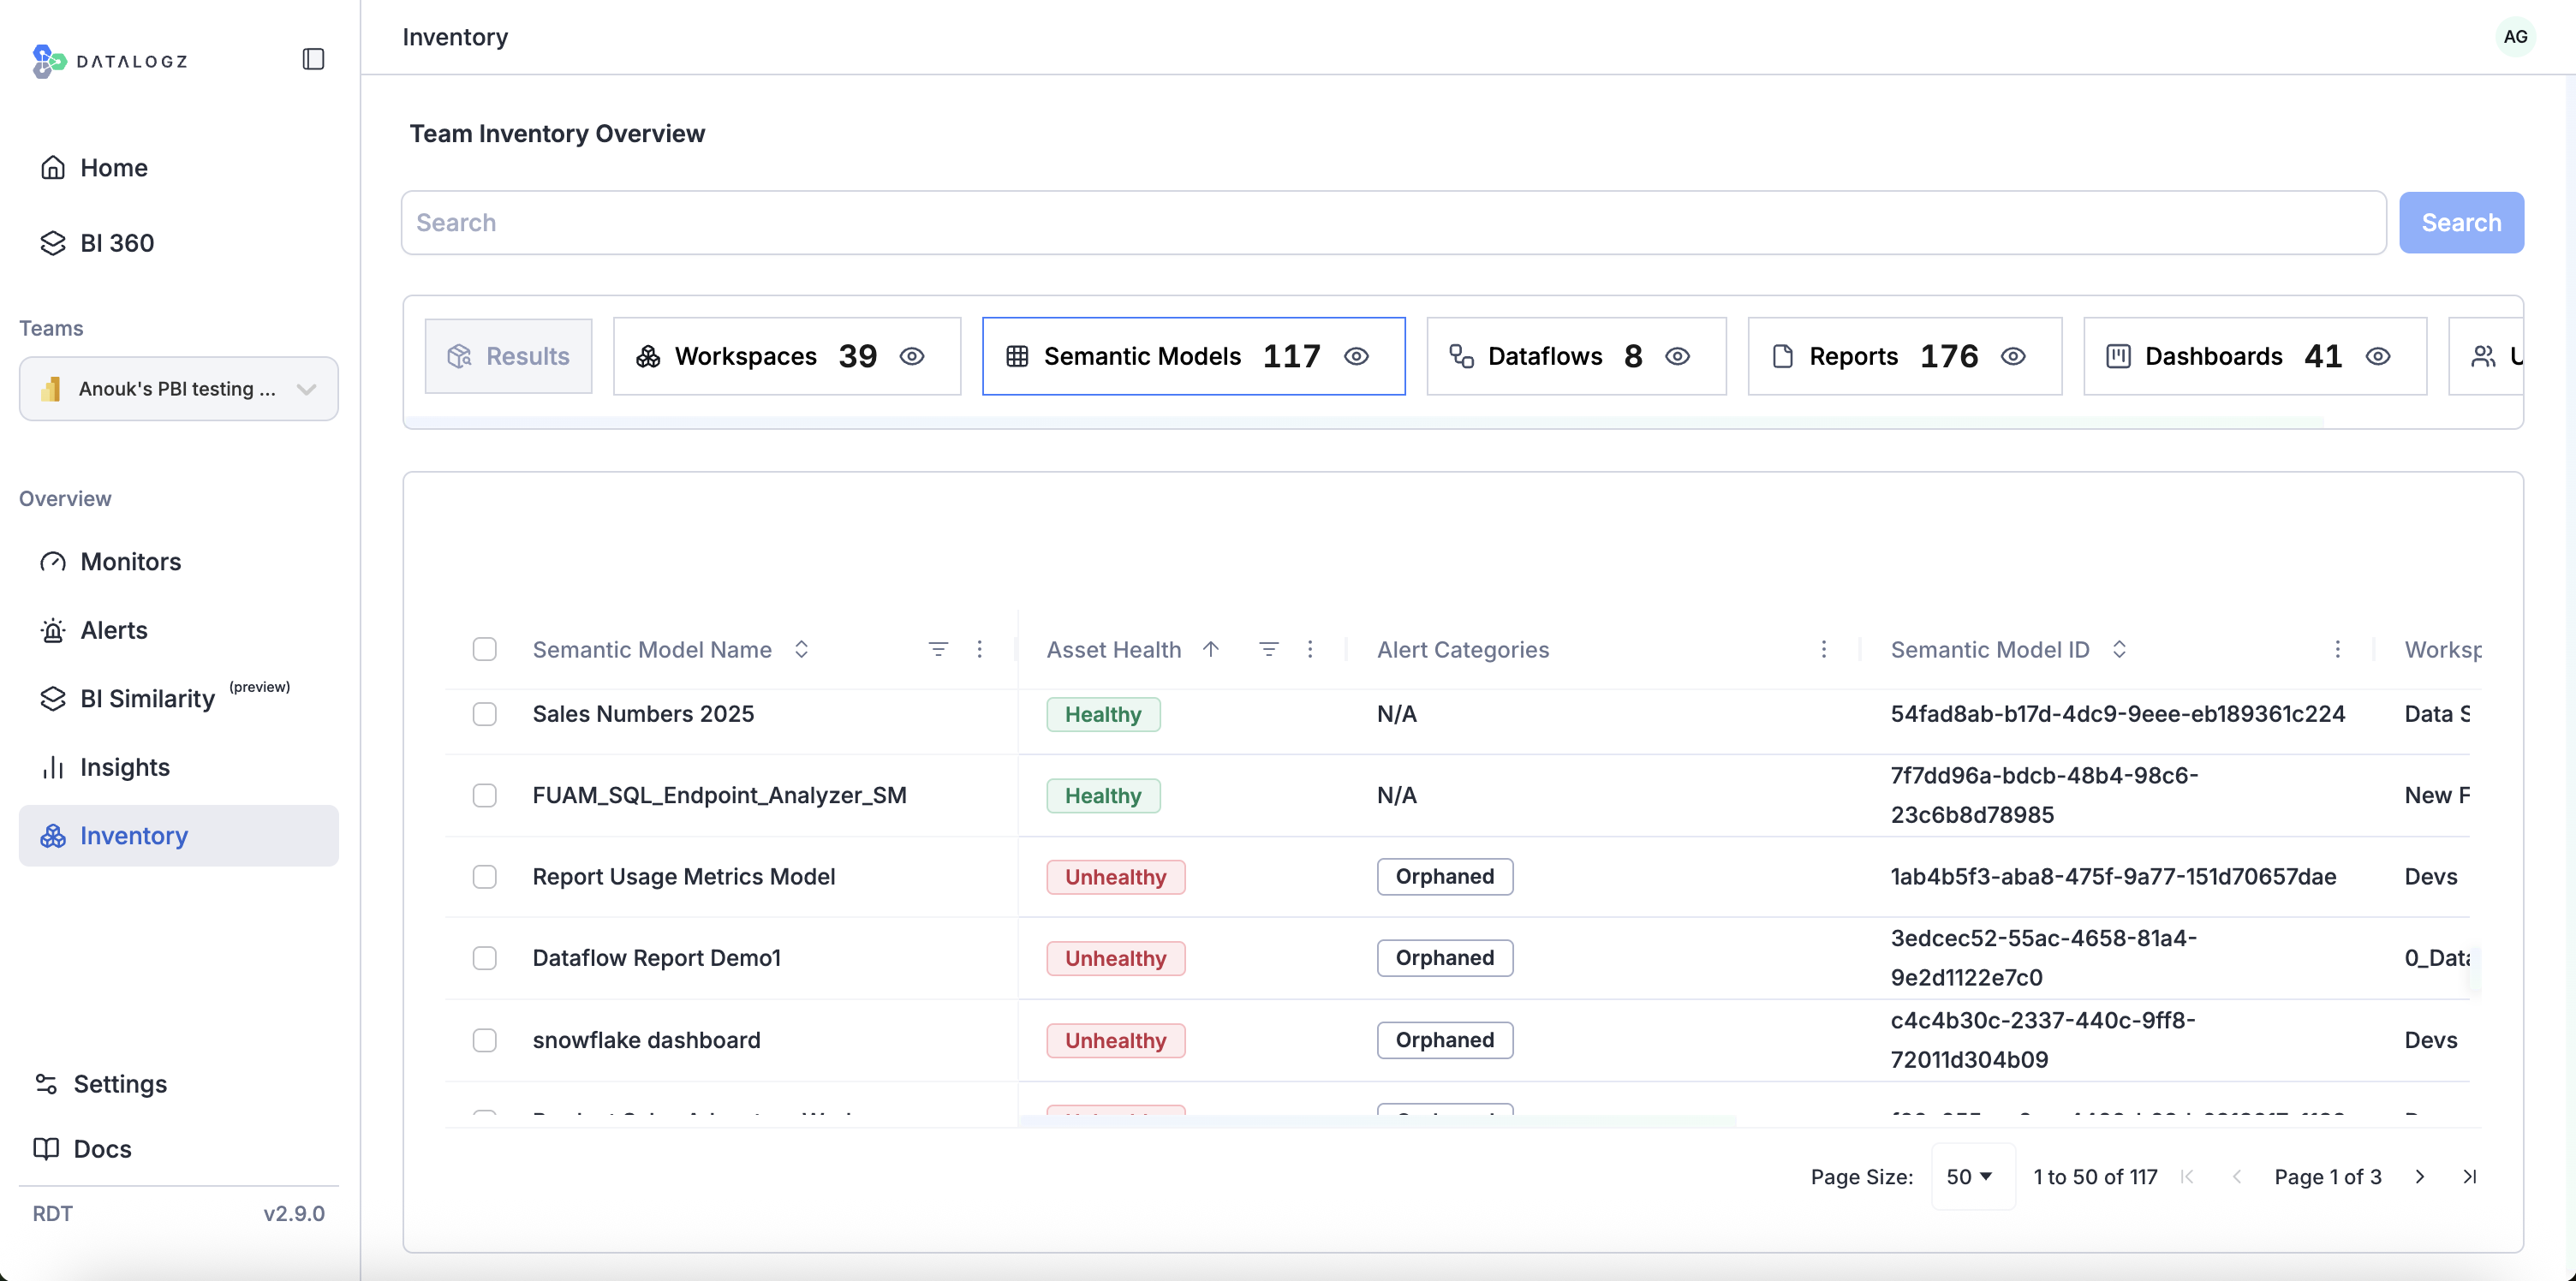
Inventory is your operational catalog of every BI asset across tools (Power BI, Tableau, Qlik Sense, Sigma, Spotfire, Databricks, and SharePoint). Built from platform metadata and usage logs, it is the door to governance, cost control, and migrations of your BI estate.
Inventory opens on two tabs. [**Summary**](/guides/inventory/inventory-summary.md) is where you start: estate-level health and usage ratios, what was created or updated in the last 30 days, your most-viewed reports, and your favorites, enough to tell you where to spend the day. [**Assets**](/guides/inventory/search-views-and-filters-in-the-inventory-table.md) is the full searchable grid, with the columns, filters, and views you need to turn any of those signals into a worklist.
**Inventory views:**
* **Team Inventory** that shows all assets within a defined team boundary (its projects, streams, or workspaces), with ownership and health in context.
* [**Global Inventory**](/guides/bi-360/global-inventory.md) that has a cross-platform search and filtering across all connected BI tools, so you can discover, compare, and act on assets across the entire estate.
### What Inventory tracks
* **Change detection**: the "Start here" panel shows what was created and updated in the last 30 days, with field-level detail on datasets, so the renamed column that silently breaks a downstream report surfaces in days instead of weeks.
* [**Assets**](/guides/inventory/asset-details.md)**:** workspaces/projects/streams, folders, reports & dashboards, datasets/extracts, data sources, KPIs, and more.
* **Operational state:** staleness, failed refreshes, orphaned assets, and similarity alerts, each linked to the asset with quick actions to resolve.
* **Users & ownership:** stable IDs, licenses, owners, and teams.
* **Usage & trust:** views over time, last-edited dates, sensitivity/endorsement.
* [**Asset Health**](/guides/inventory/asset-health.md)**:** a clear label indicating whether an asset is healthy or needs attention.
---
# Agent Instructions
This documentation is published with GitBook. GitBook is the documentation platform designed so that both humans and AI agents can read, navigate, and reason over technical content effectively. Learn more at gitbook.com.
## Querying This Documentation
If you need additional information that is not directly available in this page, you can query the documentation by asking a question.
Perform an HTTP GET request on the following URL with the `ask` and `goal` query parameters:
```
GET https://docs.datalogz.io/guides/inventory.md?ask=&goal=
```
`ask` is the immediate question: it should be specific, self-contained, and written in natural language.
`goal` is what the user is ultimately trying to achieve, the reason they need the answer. Sharing it helps GitBook give you a better, more relevant answer. A goal is most helpful when it describes the outcome the user wants rather than restating the question. For example, with `ask=how do I create an API token`, a goal like `automate deployments from our CI pipeline` lets GitBook tailor the answer to that use case.
The response will contain a direct answer to the question and relevant excerpts and sources from the documentation.
Use this mechanism when the answer is not explicitly present in the current page, you need clarification or additional context, or you want to retrieve related documentation sections.